Microsoft Excel is a spreadsheet software developed by Microsoft that helps users organize, analyze, calculate and visualize data using rows, columns, formulas, charts and automation tools like VBA and Power Query. It is available on different operating systems, including Windows, macOS, iOS and Android. This means you can use it anywhere you want.
It is quite a popular tool for data analytics and visualization among different professionals like data analysts, business analysts, accountants, financial experts, project managers, and even students.
Do you know what is Microsoft Excel and how it can help you? I have been using Microsoft Excel professionally for reporting, performance tracking and dashboard creation across multiple projects. Over time, I have seen how it has evolved from a basic spreadsheet application into a powerful analytics platform integrated with AI and automation tools. I have created this guide to share everything you need to know about this tool to get started.
Microsoft Excel is spreadsheet software used for data-related tasks, including data storage, data analysis, data visualization, and reporting. It also helps to perform different calculations used for finance, banking or accounting. It is also best for business use to manage budgets, track sales, analyze performance, and generate reports.
This spreadsheet tool also offers advanced features such as PivotTables, Power Query, conditional formatting, data validation, and automation through macros and VBA. These features allow users to handle large datasets efficiently, uncover insights, and automate repetitive tasks.

There are many reasons why you should choose Microsoft Excel. Here are some of the common ones:
It is more than just a spreadsheet program. It is a core business tool used by millions worldwide for everything from basic record keeping to complicated analysis. Organisations across industries (small startups and large enterprises) depend on it for budgeting, forecasting, performance tracking, and operational reporting.
Over 750 million people globally use Excel in their daily work, and about 80% of businesses depend on it for essential tasks like financial planning, data analysis and reporting.
This tool holds accounting dominance and remains a primary tool for accountants and finance teams. It combines ease of use with deep calculation and reconciliation capabilities. Even with newer financial systems available, Excel formulas are still widely used to verify figures, build financial models and prepare audit-friendly reports.
Another major advantage is support for data-driven decision-making. It transforms raw data into insights through charts, PivotTables and analytical formulas. This enables teams to spot trends, measure performance and make strategic choices with confidence.
In addition to the reasons mentioned above, there are also core features of Microsoft Excel that make it an essential tool to use in 2026. Let’s explore them to understand how they can help us in real-world operations.
At the foundation of Excel are spreadsheets and workbooks. A workbook is the main Excel file and it can contain multiple worksheets (spreadsheets) inside it. Each worksheet consists of rows and columns that form cells where data is entered.
This structured grid system allows users to store, sort, filter and organize large volumes of data efficiently. Businesses use worksheets to maintain sales records, employee data, inventory lists and financial reports in a well-organized manner.
Formulas and functions are the heart of this platform. A formula is an expression that performs calculations, while functions are predefined formulas designed to simplify complicated operations.
For example, functions like SUM(), AVERAGE(), IF(), VLOOKUP() or XLOOKUP() help users calculate totals, analyze conditions and retrieve data quickly. These tools are widely used in finance, accounting and analytics to reduce manual effort and improve accuracy.
This software makes data easier to understand through charts and visualization tools. Instead of analyzing raw numbers, users can create visual representations such as bar charts, line graphs, pie charts and dashboards. Data visualization helps identify patterns, trends and comparisons quickly. This feature is especially useful for presentations, performance tracking and management reporting where visual clarity is important.
Pivot Tables are one of the most powerful features of this tool for data analysis. They allow users to summarize large datasets in seconds without writing complicated formulas. With Pivot Tables, you can group data, calculate totals, count values and analyze trends dynamically. This feature is heavily used in business reporting, sales analysis and financial summaries.
Excel supports automation through VBA (Visual Basic for Applications). VBA allows users to create macros that automate repetitive tasks such as formatting reports, cleaning data or generating summaries. This reduces manual effort, saves time and minimizes errors. It is mostly used by organizations to build custom tools and streamline workflows inside Excel.
In recent versions, Excel has expanded automation beyond VBA by introducing Office Scripts and integration with Microsoft Power Automate. This allows users to automate cloud-based workflows, schedule data refreshes and connect Excel with external applications without deep programming knowledge.
Power tools like Power Query and Power Pivot are advanced features designed for large-scale data processing and business intelligence. In Microsoft 365, Power Query now supports AI-assisted data transformation suggestions and improved data profiling. Power Pivot enables complex data modeling with relationships and DAX calculations, making Excel capable of handling semi-enterprise-level datasets efficiently.
Read Also- Microsoft Fabric vs Power BI
You may have a basic overview of where you can use this spreadsheet tool in your daily life or maybe you are still unsure about its practical importance. That is completely normal. Many beginners understand it theoretically but struggle to connect it with real-world use. To make things clearer, let’s explore how this software is actually used across different industries and job roles.
It is one of the most trusted tools for managing numbers and making financial decisions. Companies use it to prepare budgets, forecast revenue, track expenses and create financial statements. It is used to create financial models that can predict future growth and profitability.
This tool plays a major role in data analysis. Data analysts use it to clean raw data, apply formulas, create PivotTables and generate meaningful insights. It allows users to filter large datasets, identify trends and compare performance over time. Its tools like conditional formatting and charts, help transform complicated data into understandable reports.
Human Resource teams can use it to manage employee records, attendance, payroll data and performance tracking. It helps in organizing structured employee databases without needing expensive software. Operations teams rely on it to monitor workflow, track operational costs and maintain process documentation.
Sales teams can use it to track leads, monitor sales targets, analyze monthly performance and generate sales reports. It helps compare targets versus achievements and identify high-performing products or regions. It also has an inventory management feature that helps in tracking stock levels, monitoring product movement and preventing shortages or overstocking.
This platform is widely used in project management to create timelines, task lists and progress trackers. Teams usually use it to assign responsibilities, track deadlines and monitor budgets. It also provides simple Gantt charts and project dashboards to visualize project progress.
Let’s come to the technical part now, starting with the basic concepts of Microsoft Excel. Skipping the fundamentals often leads to confusion while working with data. On the other hand, understanding them always helps beginners to build confidence and core skills.
Rows, columns and cells form the basic structure of Excel. A row runs horizontally across the worksheet and is identified by numbers such as 1, 2, 3, and so on. A column runs vertically and is identified by letters such as A, B, C, etc.
A cell is the intersection point of a row and a column that always has a unique address. For example, A1 refers to column A and row 1. This cell reference system allows you to enter data and use formulas accurately.
Many beginners get confused between worksheets and workbooks. A workbook is the entire Excel file that you save on your computer. Inside a workbook, you can have multiple worksheets with rows, columns and cells that will store your data. Think of a workbook as a notebook and worksheets as individual pages inside it.
A spreadsheet is a digital grid made up of rows and columns used to organize, store and analyze data. In simple terms, a spreadsheet allows you to enter numbers, text and formulas into cells to perform calculations and manage information efficiently. It replaces manual record-keeping methods and makes data handling faster, more accurate and more organized.
Once you know the basics, it is time to understand the Excel formulas and functions. We will start with the basic and most used formulas like sum, average, if and more.
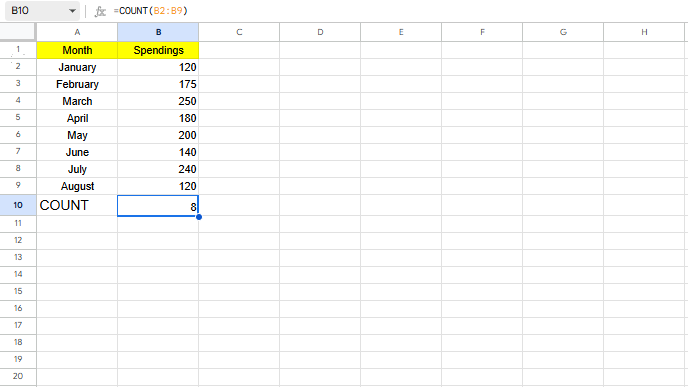
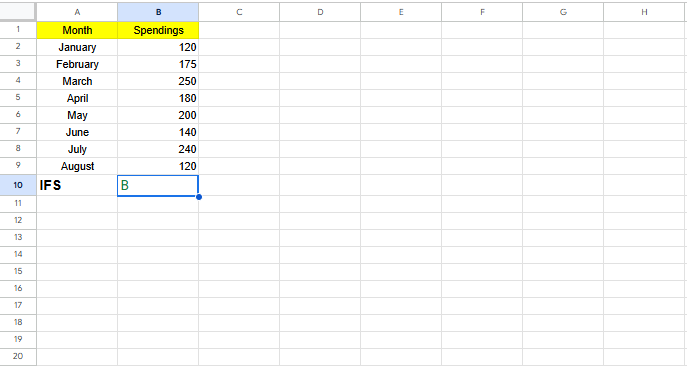
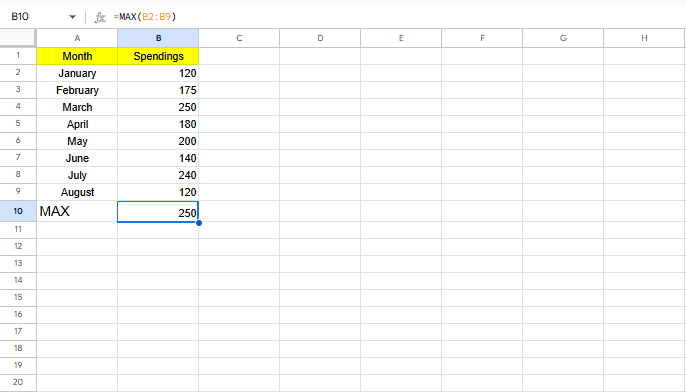
Once you are comfortable with basic concepts and formulas, the next step is learning its advanced capabilities. These features help you analyze complex datasets, automate logical decisions and extract meaningful insights from raw numbers. Here are the ones:
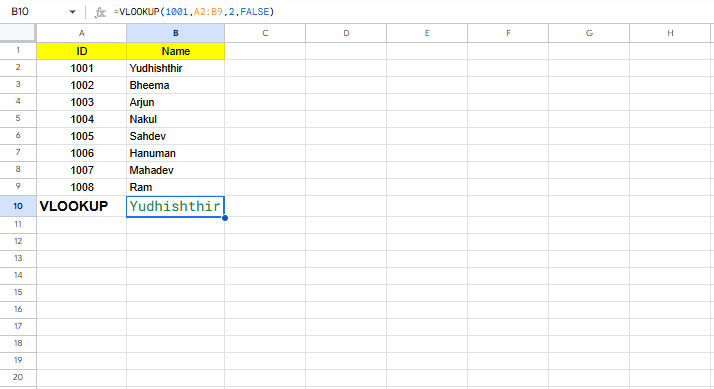
Lookup functions are used to search for specific data in a table and return related information from another column. There are two most used Lookup formulas that are always in the talk including XLOOKUP vs VLOOKUP. Let’s understand them:
| Feature | VLOOKUP | XLOOKUP |
|---|---|---|
| Full Name | Vertical Lookup | Extended Lookup |
| Availability | Available in older Excel versions | Available in Excel 365 & Excel 2019+ |
| Lookup Direction | Left to right only | Left, right, up, down (any direction) |
| Column Reference | Uses column index number | Uses direct column reference |
| Exact Match Default | No (approximate by default) | Yes (exact match by default) |
| Error Handling | Requires IFERROR separately | Built-in error handling |
| Multiple Criteria | Complex setup required | Easier with dynamic arrays |
| Ease of Use | Slightly complex | More flexible and user-friendly |
| Performance | Slower with large datasets | Better performance with large datasets |
| Future Support | Older function | Modern replacement for VLOOKUP |
Pivot Tables are powerful tools used to summarize and analyze large amounts of data quickly. Instead of writing complicated formulas, you can drag and drop fields to generate summaries like totals, averages, counts or percentages. They are widely used for sales analysis, performance reporting and financial summaries. Pivot Tables make it easier to identify patterns, compare categories and create dynamic reports in just a few clicks.
Conditional Formatting automatically changes the appearance of cells based on certain conditions. For example, you can highlight values greater than a target, mark duplicate entries or use color scales to visualize performance. This feature improves data readability and helps users quickly identify important trends or issues without manually scanning every row.
The TREND function is used for forecasting and predicting future values based on historical data. It applies a linear regression method to estimate future outcomes. For example, if you have monthly sales data, the TREND function can help predict future sales growth. It is especially useful in financial forecasting, performance analysis and business planning.
Logical functions like AND and OR help perform decision-based calculations. The AND function returns TRUE only if all given conditions are met. The OR function returns TRUE if at least one condition is met. These functions are often combined with the IF function to create advanced logical formulas.
Related Article: MS Excel Cheat Sheet
Starting with basic theory is the best starting point for getting started with this tool, but it is sufficient without real-world examples. Let’s walk through a simple example where we calculate total sales and then create a Pivot Table to analyze performance. This will help you understand how this tool works in real-world situations.
Let’s take a sample of sales data:
| Product | Month | Sales |
|---|---|---|
| Laptop | Jan | 5000 |
| Laptop | Feb | 6000 |
| Mobile | Jan | 3000 |
| Mobile | Feb | 4000 |
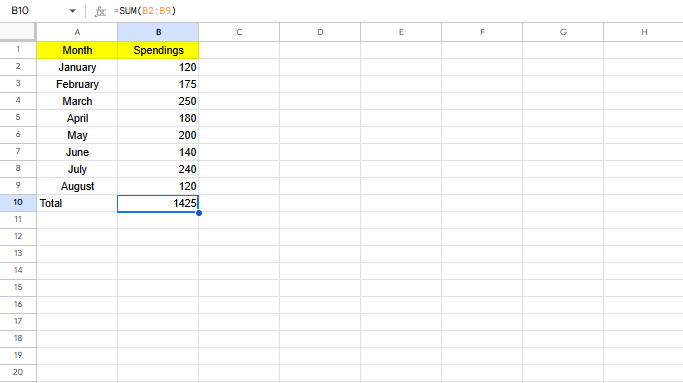
Take the data in your spread sheet and apply the formula in a cell as shown in the image given below:
|
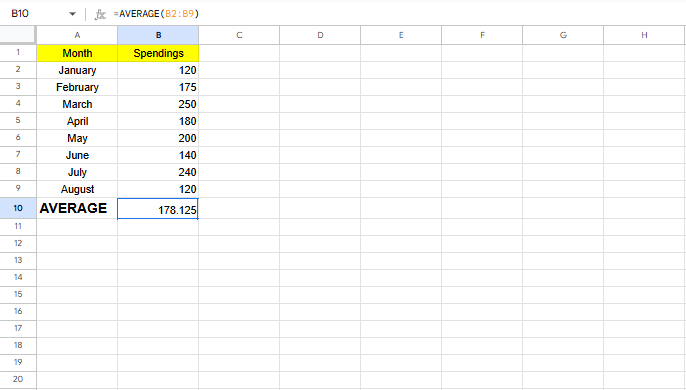
This will calculate total sales automatically. Now calculate average:
|
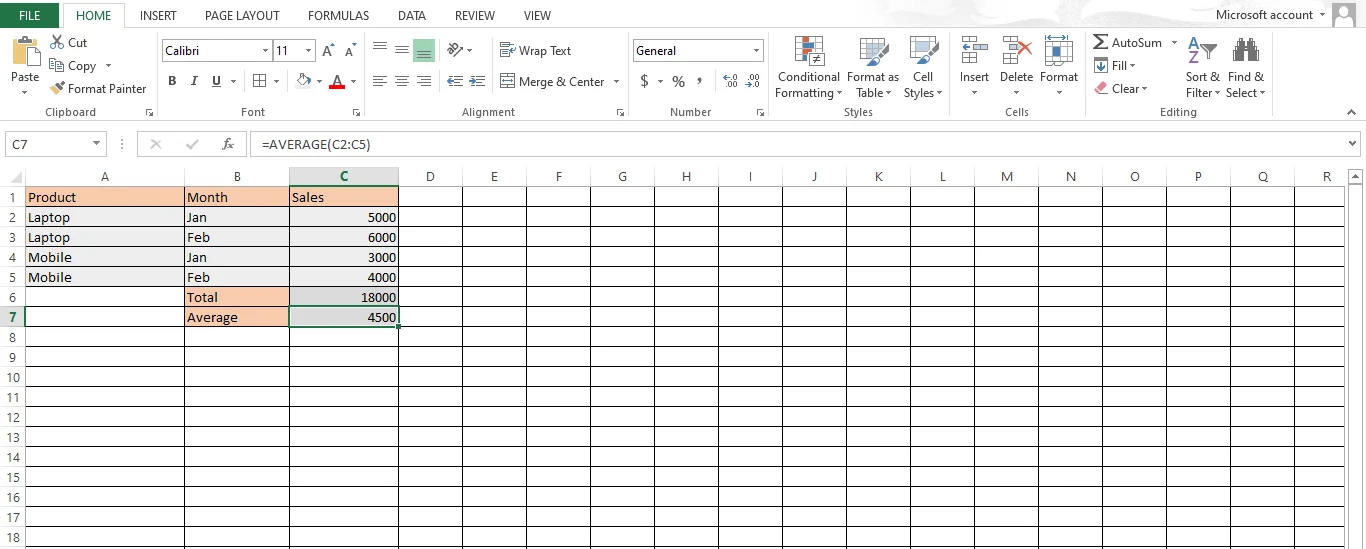
This will calculate the monthly performance.
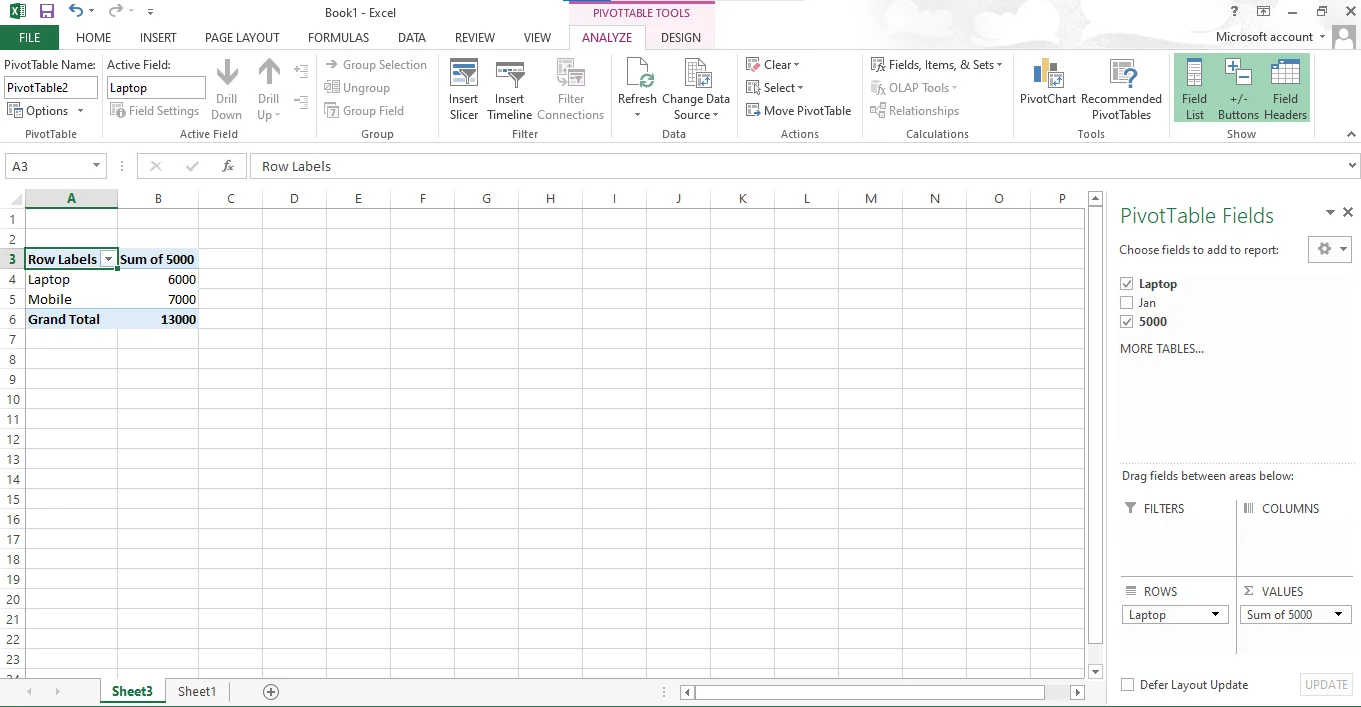
Now we can summarize sales by product. Follow the given steps to create a Pivot table.
1. Select the data
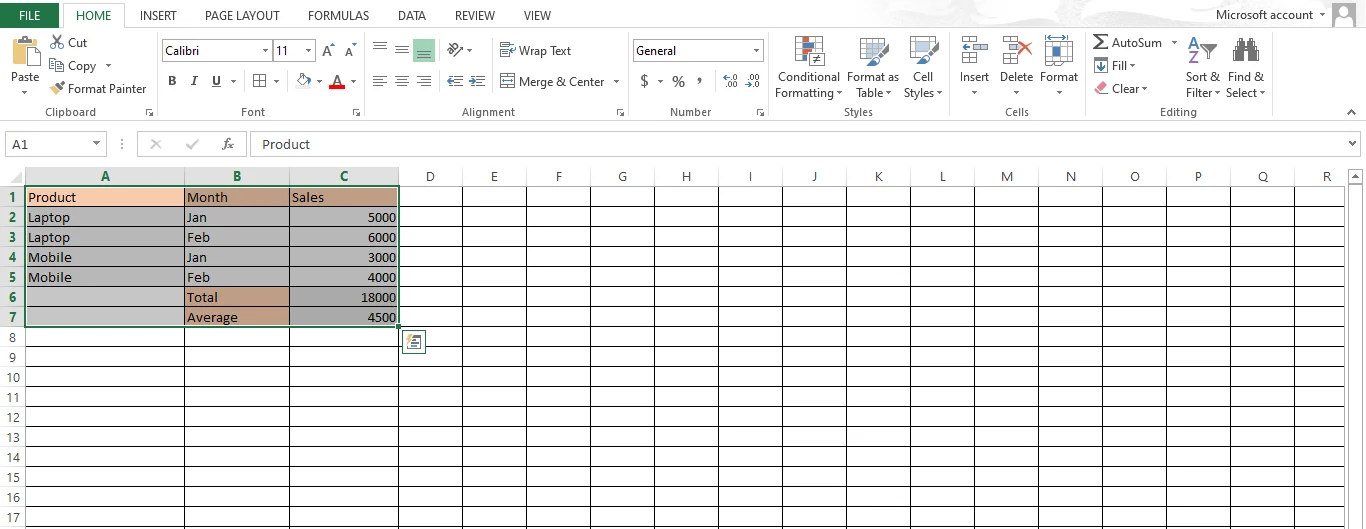
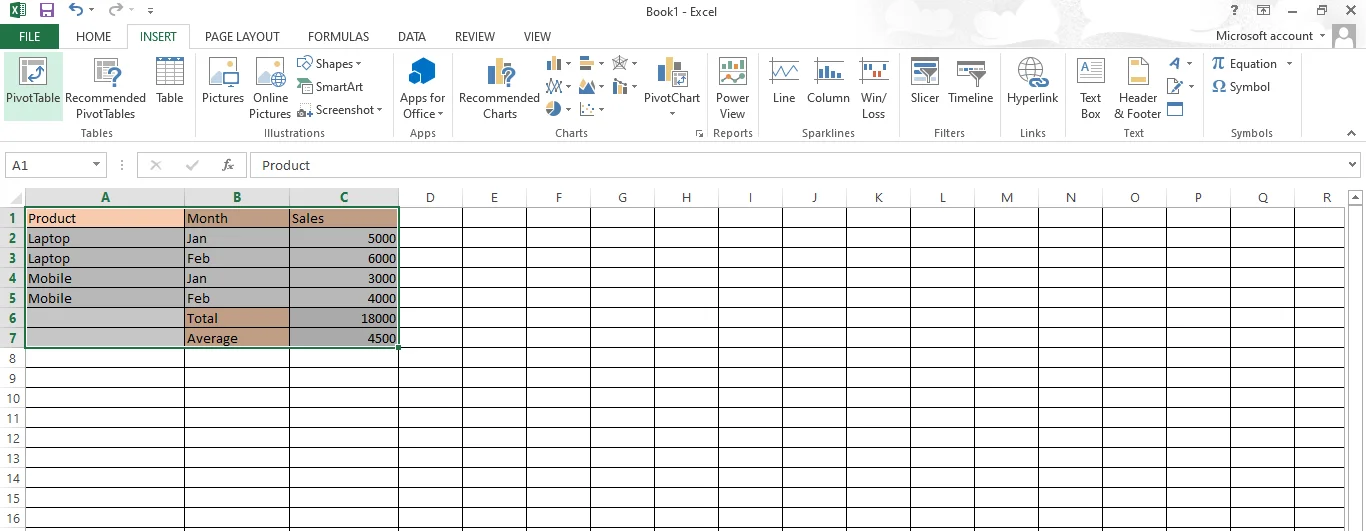
2. Click Insert and then Pivot Table
3. Drag from Product to Sales and click on the Ok button.
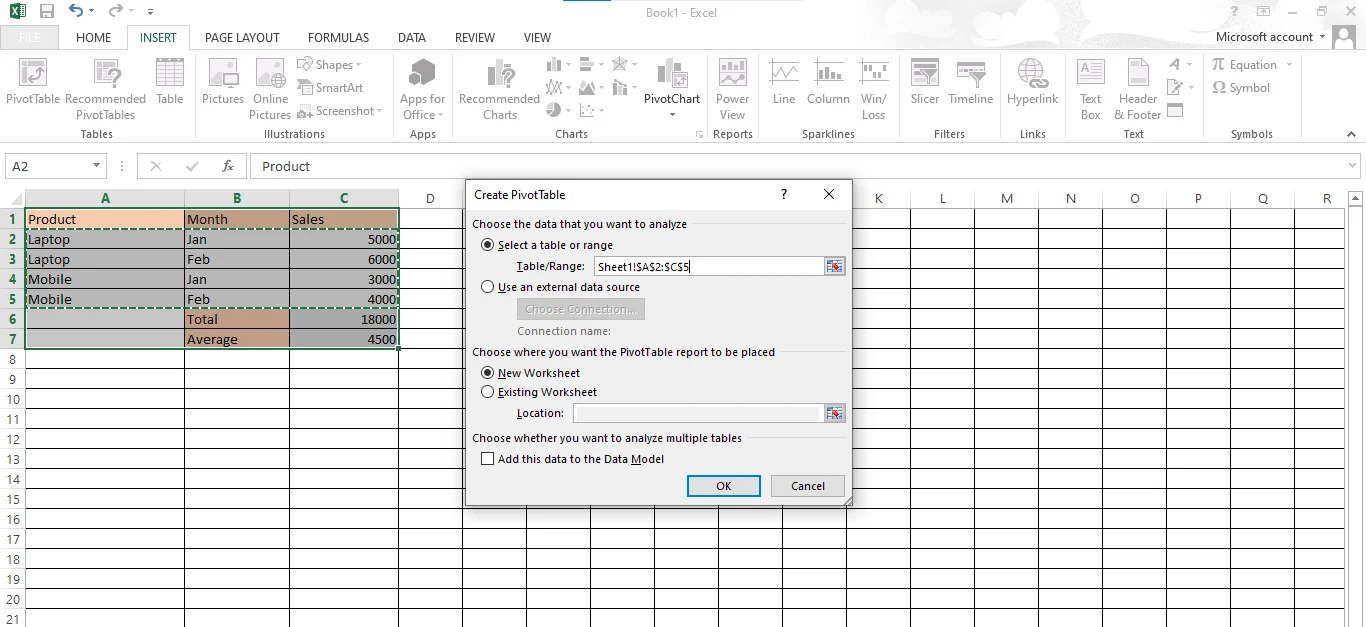
4. Now you will be asked to select the field to create the pivot table. Select the elements you want in the table and the table will be created.
Microsoft Excel and Google Sheets are the two of the best spreadsheet tools you can use today. Both are powerful and used for almost the same applications. They differ in pricing, collaboration style, advanced capabilities and scalability. The table given below will help you understand which one to choose.
business intelligence platformsApart from Google Sheets, there are multiple Excel alternatives you can look for. Here are some of them:
| Tool | Best For | Key Advantage |
|---|---|---|
| Zoho Sheet | Small businesses | Good automation features and Zoho ecosystem integration |
| LibreOffice Calc | Offline users | Free and open-source desktop spreadsheet software |
| Smartsheet | Project management | Spreadsheet-style interface with project tracking features |
| CryptPad | Privacy-focused users | Encrypted collaboration with strong data privacy |
Microsoft Excel has evolved significantly since its first launch in 1985 as the Microsoft Multiplan. It is now transformed from a basic spreadsheet tool into a powerful data analysis and business intelligence platform. Below is a simplified timeline highlighting key milestones in its development.
| Version | Launch Year | Description or Updates |
|---|---|---|
| Multiplan | 1982 | Early Microsoft spreadsheet (predecessor to Excel) |
| Excel 1.0 (Mac) | 1985 | First official Excel release |
| Excel 2.0 (Windows) | 1987 | First Windows version; competed with Lotus 1-2-3 |
| Excel 3.0 | 1990 | Introduced toolbars, 3D charts, and drawing tools |
| Excel 4.0 | 1992 | Added AutoFill feature |
| Excel 5.0 | 1993 | Introduced VBA (Visual Basic for Applications) |
| Excel 2007 | 2007 | Ribbon interface, new file format (.xlsx) |
| Excel 2013 | 2013 | Flash Fill, Power Pivot improvements |
| Excel 2019 | 2019 | Modern functions like XLOOKUP |
| Microsoft 365 Excel | 2020 | Introduced dynamic arrays, XLOOKUP improvements, the LET function and enhanced real-time collaboration features |
| Microsoft 365 Excel | 2021 | Added XMATCH, LAMBDA functions, performance optimizations and cloud-based workbook sharing improvements |
| Microsoft 365 Excel | 2022 | Expanded Power Query capabilities, automation improvements and tighter Microsoft Teams integration |
| Microsoft 365 Excel | 2023 | Introduced Python integration in Excel preview, AI-assisted formula suggestions and advanced data connectivity |
| Microsoft 365 Excel | 2024 | Expanded Excel Copilot AI features, improved automation with Power Automate and enhanced Power BI connectivity |
| Microsoft 365 Excel | 2025 | Improved AI-powered analytics, faster cloud collaboration, smarter forecasting tools and enhanced security capabilities |
| Microsoft 365 Excel | 2026 | Advanced AI-assisted spreadsheet analysis, deeper Python integration, automated business insights and enterprise-grade real-time analytics features |
This guide has explained everything around what is Microsoft Excel from the very basics and its components, formulas and alternatives. It is a perfect guide to get started with this spreadsheet platform. Further, you can also explore our additional guides to deep dive into its advanced concepts.
It is used for storing, organizing, analyzing and visualizing data. It can perform calculations, create reports, track budgets, manage inventory and analyze performance.
Getting started with this platform includes understanding basic concepts, formulas and functions and practicing that knowledge in the real world tasks.
Its importance to business is because it supports financial planning, budgeting, reporting, forecasting and performance tracking.