Picking Power BI renders many compelling advantages for individuals and businesses. Those seeking robust visualization and data analytics solutions should opt for it.

A leading visual analytics tool like Tableau is the key to getting there. Earning Tableau certifications as per one's current skills and future goals is the unlocking point to success..

Cognos is an extremely powerful business intelligence tool. It was developed by IBM and crafted to enable organizations in making informed decisions via data-driven insights. This tool is gaining popularity among different organizations in distinct..

Every business today wants to enjoy an advanced tool for analyzing and visualizing data in a user-friendly way. There are multiple tools in the market claiming to streamline the various complex business operations.

Business intelligence (BI) is an important pole of success for companies in most industries. The ability of taking out valuable insights from data has never been more important and...
People usually think about data collection or data analysis when a conversation about data begins. Data visualization usually comes a little later in those talks and even in the process. But just because it's a much later step does not mean that one should..
Decisiveness and diligence are the two main points to consider while making decisions for business improvement. This is why many business owners, practitioners and learners face a dilemma when..

Business intelligence is a compound set of technologies and strategies to analyze business data and transform it into highly actionable insights for strategic decisions. Information is everywhere and businesses that unearth information to use..

Data analysis and visualization is facilitating enterprises in creating dashboards for different instances. This has created a great demand for business intelligence tools. Power BI...

Business Intelligence or BI is an elaborate concept inclusive of a lot of aspects such as data analytics, visualization, infrastructural practices, and data mining. The goal is to make data-driven..
Tableau is an extremely powerful data visualization tool. It has completely transformed how analysts and businesses explore and consequently interpret data. It helps users in creating shareable..
Power BI brings information and numbers to life for telling stories and making data driven decisions. It is a powerful tool for turning raw data into highly meaningful insights. Getting started with this tool to go from..

Business intelligence (BI) has become crucial to turn data into information, which itself plays a big role in enabling organizations to take data-driven decisions. It comprises various tools and techniques that aid in extracting meaningful information..

Cognos Analytics platform pertains to an exceptionally powerful tool for business intelligence as well as performance management. It presents various comprehensive solutions for data reporting..

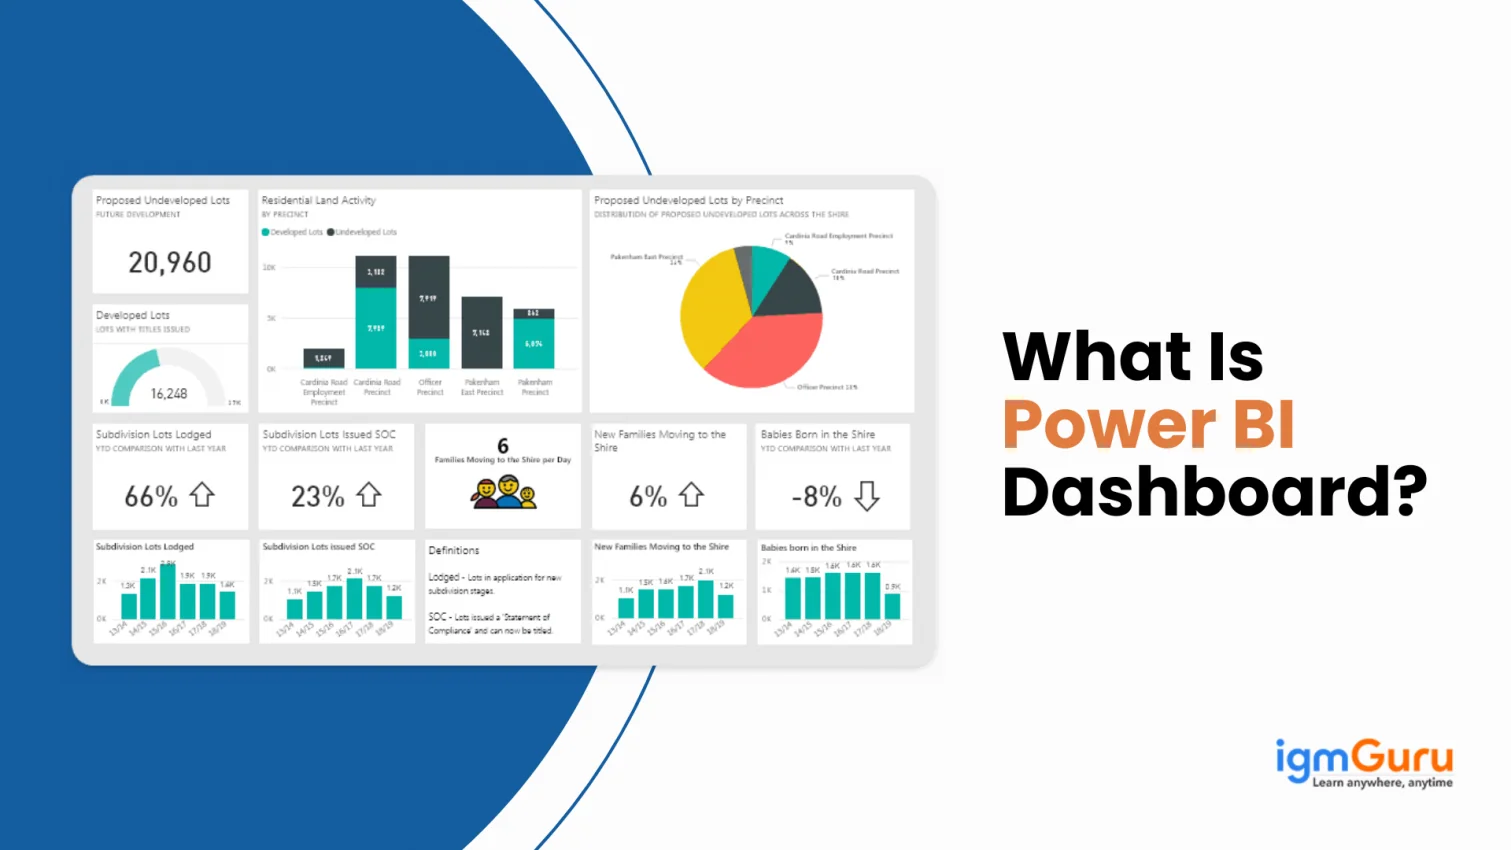
Power BI Desktop is among the top powerful business analytics tools released by Microsoft. It has been crafted to facilitate users in visualizing data and sharing insights throughout the organization.

Power BI holds a good number of users due to its undeniable benefits and features. Leveraging its useful tools, businesses are performing much better then before.
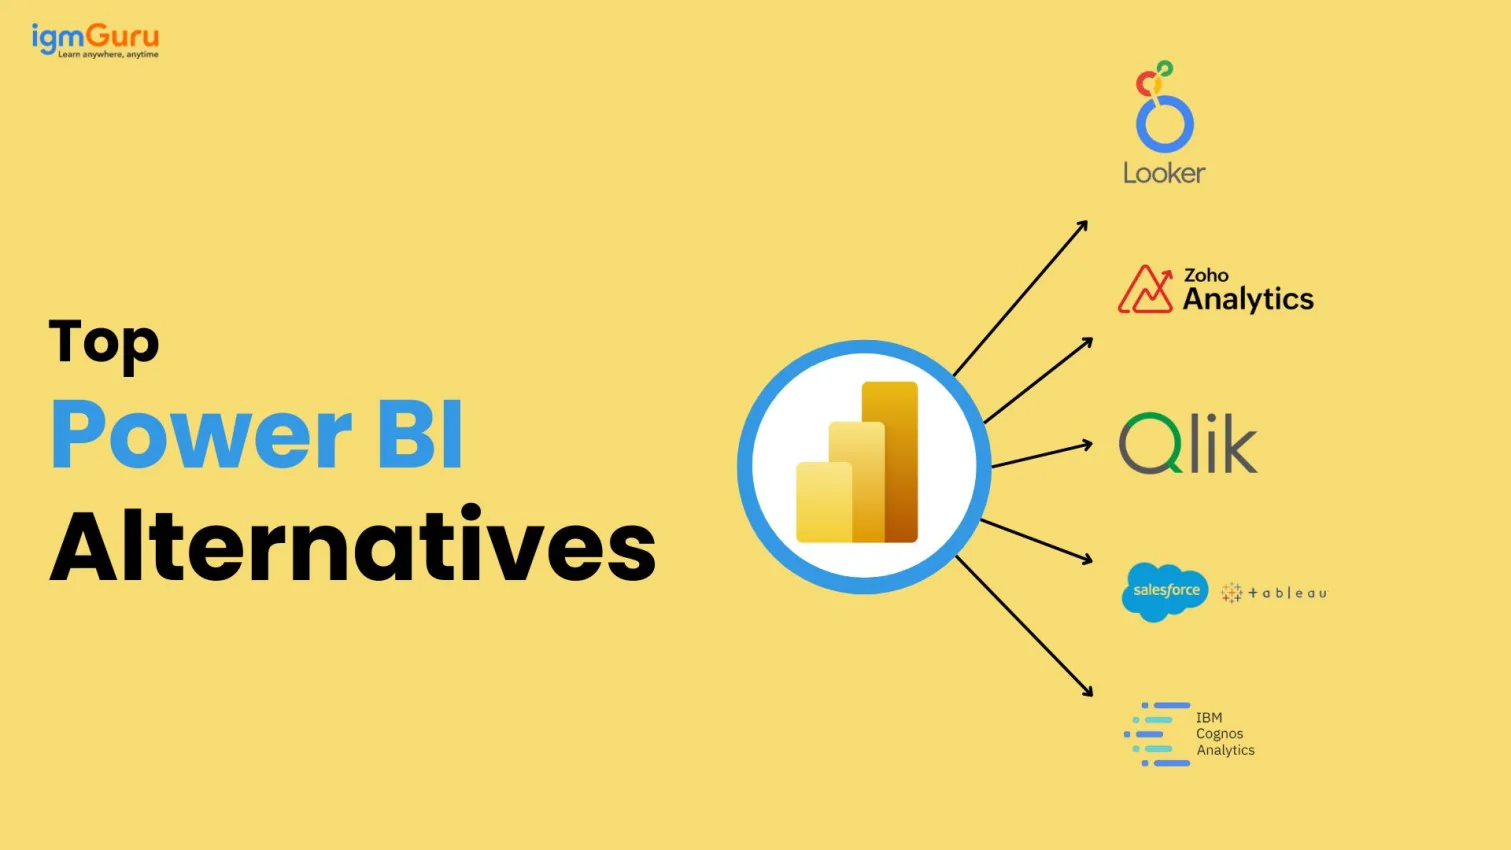
Power BI has become one of the go-to tools for business intelligence and data visualization, thanks to its robust features and tight integration with Microsoft products. But while it's a powerful platform, it's not necessarily the perfect fit for every..

Analytics has become a scorching hot topic these days as we are living in a data dominated world. Many companies are now using different types of analytical tools to stay ahead in this era. Power BI is one of them..

Most companies do not face the issue of acquiring data but how to best work on it and visualize it. Visualization and reporting is a key factor in ensuring that the data is optimally utilized.
Creating a dashboard in Power BI includes multiple steps. Right from connecting to multiple data sources to engaging in customizing and sharing the end dashboard, there are many imperative steps.

As we all know that Tableau is the most powerful data analysis and visualization tool. It's has become the mainstream for many businesses to scale up their stats. Using this, businesses can easily create actionable data and produce the..
QlikView is used for managing relationships between data and visualizing them with colours. It has the capability to manage complicated datasets from different sources like..

What is Power BI architecture? Power BI architecture is crafted to enable seamless integration of data transformation, collection, sharing and visualization processes into a single platform.
Data analysis of business information must be done on time and by leveraging the right means. Appropriate business intelligence tools must be implemented to help decision makers be certain of the..

To understand the Power BI Developer salary in India, it is imperative to understand what these professionals do. There are dozens of factors that influence what a professional ultimately gets paid.

SAP Analytics Cloud is at the forefront of making a deep impact on how data is handled and utilized. Companies are increasingly turning towards data-driven strategies and that increases..

Looker is tagged as one of the most powerful business intelligence tools out there today. It aids organizations in analyzing and visualizing data in real-time. For a beginner, learning Looker..
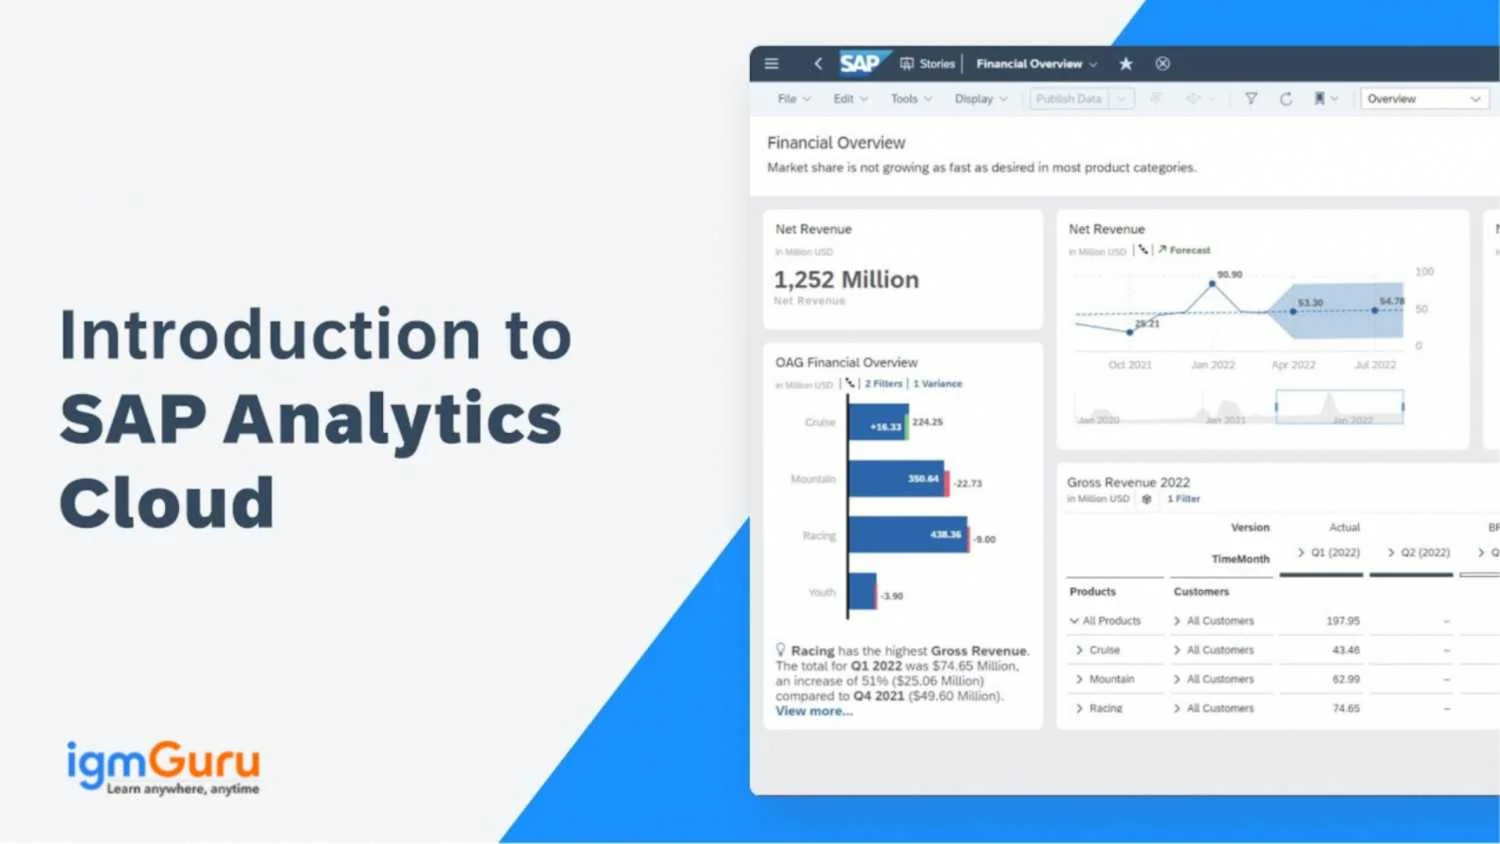
SAP Analytics Cloud is an 360- degree, all-encompassing solution that combines business intelligence, predictive analytics and planning. It was developed to be a support to organizations in..

Data Economy is a real winning term these days and the reason behind its raging success is our increasing ability to consume, read, and gather actionable insights from the data at hand. Employees..

Over 9508 companies are using QlikView as a dashboarding tool around the globe. But why is it used globally and how can it benefit you? This QlikView tutorial is especially designed by our well experienced instructors. This gives every answer..